By: Matthew Martin, XRG Technologies
Fired heaters emit an estimated 400 to 500 million tons of carbon dioxide (CO2) every year. At least 73% of average refinery CO2 emissions come from combustion [1]. For refineries and petrochemical plants focused on reducing greenhouse gas emissions, it makes sense to target CO2 from fired heaters. Fired heaters usually have a fuel efficiency of 70-93%, so improvements in fuel efficiency enable CO2 reduction. They are usually fueled by either carbon-bearing refinery fuel gas or natural gas, so further CO2 reduction is possible by changing to fuels with less carbon content.
Project Economics for Increasing Efficiency
Many of the fired heaters that are large emitters of CO2 are already the most efficient. Reduced fuel consumption from a refinery’s highest heat release heaters reduces the operating cost of the refinery. Installation costs do not scale linearly with heater size and so smaller units have been less attractive targets for efficiency increasing projects. Anecdotally, the fuel efficiency of existing heaters varies throughout the world with the regions having the highest fuel cost also have the most efficient heaters. While the high efficiency of the largest CO2 emitting heaters may be beneficial to the existing CO2 footprint of a refinery, it also leaves less room for improvement by increasing heater efficiency.
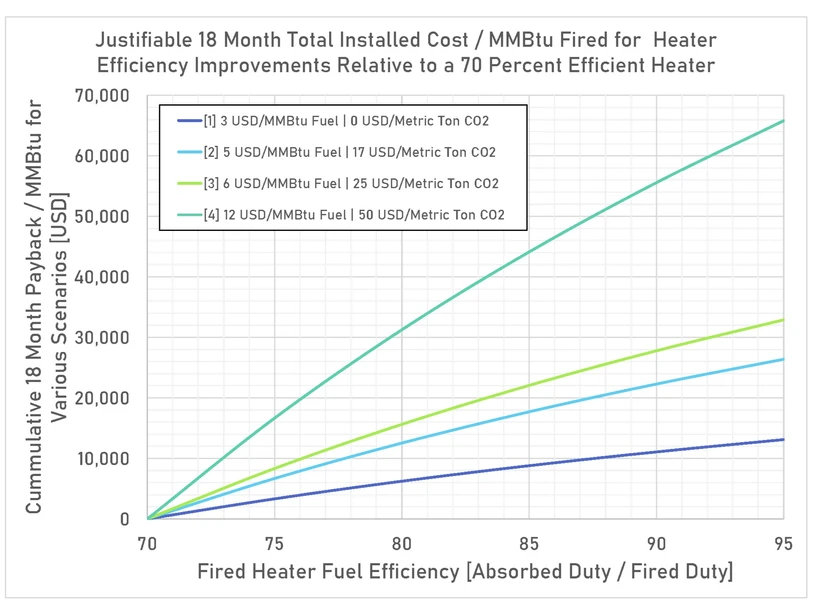
Figure 1 – This graph shows the required total installed equipment cost for an 18-month payback relative to a 70% efficient heater.
Figure 1 shows the justifiable total installed cost for fired heater improvements compared to a 70% fuel-efficient heater for various fuel and CO2 cost scenarios labeled with numbers (1-4). The graph can be used to estimate a justifiable 18-month return-on-investment (ROI) project cost when moving between any two points on the horizontal axis and multiplying by the fired duty of the heater. The calculations used to generate the graph assume 340 days of operation per year. To scale the acceptable project cost by a different time frame, multiply the result by the ratio of 18 months to the new time frame. A description of the listed scenarios follows:
- Fuel cost: 3 USD/MMBtu | CO2 Cost 0 USD/ton CO2: This scenario represents most of the USA at the time of writing.
- Fuel cost: 5 USD/MMBtu | CO2 Cost 17 USD/ton CO2: This scenario represents California where there is a functioning carbon market at the time of writing.
- Fuel cost: 6 USD/MMBtu | CO2 Cost 25 USD/ton CO2: This scenario represents much of the EU at the time of writing.
- Fuel cost: 12 USD/MMBtu | CO2 Cost 50 USD/ton CO2: This scenario represents a likely future state in the EU within the next 10 years.
For example, in scenario 1 using a fuel cost of 3 USD / MMBtu and 0 USD / ton CO2, which would be most regions of the USA, a project to increase a 50 MMBtu/h LHV fired duty heater from 80% efficiency to 90% efficiency would require a total installed cost to break even over 18 months as follows:
Eighteen Month Break Even Total Installed Cost

In scenario 3, which would be like current fuel and CO2 costs in the EU, the same project has a justifiable cost as follows:
Eighteen Month Break Even Total Installed Cost

Operating Expenses for Purchased Hydrogen
Redirecting hydrogen to the fired heater fuel gas system is a very cost-effective way to reduce carbon dioxide emissions. If one can sell the hydrogen from the fuel gas system, or if the hydrogen must be purchased, the operating expenses vary dramatically depending on both the cost of hydrogen and carbon credits. Hydrogen can come from various sources. ‘Green’ hydrogen is produced from completely renewable sources such as solar. The production of ‘blue’ hydrogen results in carbon dioxide emissions that are sequestered. ‘Gray’ hydrogen is produced in the conventional manner, usually reforming, without sequestration of the resulting carbon dioxide.

Figure 2 – This graph shows the increase in operating cost for adding purchased hydrogen to the fuel gas under various operating scenarios relative to no addition of hydrogen to natural gas fuel.
Figure 2 shows eight different operating scenarios for the addition of hydrogen to the fuel gas system used to fire heaters. Hydrogen costs were estimated at 2.50-6.80 USD/kg for green hydrogen, blue hydrogen at 1.40-2.40 USD/kg, and gray hydrogen at 1.00-1.80 USD/kg [2]. In scenarios (3), (6), and (8) the break-even price for adding hydrogen is calculated. For those scenarios, it is cost neutral to add any level of hydrogen, up to completely displacing all organic molecules, in the fuel of the heater. A description of the different operating scenarios follows:
- Fuel Cost: 3 USD/MMBtu | 1.00 USD/kg H2 | 0 USD/ton CO2: This scenario represents the current operating state most of the USA using low-cost gray hydrogen.
- Fuel Cost: 5 USD/MMBtu | 6.80 USD/kg H2 | 17 USD/ton CO2: This scenario represents using high-cost green hydrogen in California where there is a functioning carbon market.
- Fuel Cost: 5 USD/MMBtu | 0.65 USD/kg H2 | 17 USD/ton CO2: This scenario represents the required cost of hydrogen in California where there is a functioning carbon market such that there is no increased expense in operating the heater.
- Fuel Cost: 6 USD/MMBtu | 6.80 USD/kg H2 | 25 USD/ton CO2: This scenario represents using green hydrogen in a European refinery to supply some portion of the fuel to a fired heater.
- Fuel Cost: 6 USD/MMBtu | 1.40 USD/kg H2 | 25 USD/ton CO2: This scenario represents using high-cost gray hydrogen in a European refinery to supply some portion of the fuel to a fired heater. Note that it is very close in cost to using low-cost gray hydrogen in the USA with no carbon incentive.
- Fuel Cost: 12 USD/MMBtu | 0.76 USD/kg H2 | 25 USD/ton CO2: This scenario represents using the required cost of hydrogen in a European refinery for cost-neutral use of hydrogen in a fired heater. The required hydrogen cost is 46% less than high-cost gray hydrogen or 24% less than low-cost gray hydrogen. If hydrogen production costs go down or CO2 costs go up this could be an operating scenario soon. However, the production of gray hydrogen still releases CO2 into the atmosphere.
- Fuel Cost: 6 USD/MMBtu | 0.50 USD/kg H2 | 25 USD/ton CO2: This scenario represents current European operating costs. It also shows that, if hydrogen could be purchased for 0.50 USD/kg that the heater would make additional money for every hour of operation due to the potential sale of the carbon credits generated.
- Fuel Cost: 12 USD/MMBtu | 1.52 USD/kg H2 | 50 USD/ton CO2: This scenario could represent a European refinery in the next 10 years using blue hydrogen. In this case, the hydrogen that is used to fuel the heater is produced from a source with sequestration. The operation of the heater is also cost-neutral compared to the current operation – no additional cost is required to operate the heater regardless of the amount of hydrogen added to the fuel.
Figure 2 shows the additional operating cost of adding purchased hydrogen to the fuel gas supply of a heater normalized by the heat release. So, for example, to fire 50% additional green hydrogen in a 50 MMBtu/h heater in California at current prices (Figure 2, scenario 2), it would cost an additional:

In the EU with gray hydrogen the cost becomes (Figure 2, scenario 5):

Wobbe Number and Fuel Gas Interchangeability
Combustion equipment is designed for specific fuels or a range of fuel blends. When the burner or heater uses a fuel composition outside of this design range it may not operate correctly. The combustion characteristics of hydrogen are very different from hydrocarbons that, aside from inert components, make up a typical refinery fuel gas. A well-known measure used to compare fuel gas interchangeability is the Wobbe number (sometimes Wobbe index). If the Wobbe number of two fuels match, then the heat supplied at a given pressure will also match. The Wobbe number is calculated as follows[3]:

Most modern burners used in fired heaters can use a wide range of fuel compositions. It is not uncommon in acceptance testing that the burner will be validated firing anywhere from 100% natural gas to 80% hydrogen. Older burners may not have been tested to support high hydrogen firing.
When increasing hydrogen in the fuel gas, seemingly close Wobbe numbers can result in fuels that are not interchangeable. For example, Table 1 shows a comparison of a 50% CH4 / 50% H2 fuel blend (Fuel 1) as a reference fuel to two other fuels. These simplified fuel blends are used as an example of the difficulty, with real refinery fuel blends containing many more constituents. The Wobbe number of a 100% hydrogen fuel is only 1.89% different from the reference fuel, but it would almost certainly flashback in any premix burner. With optimization, the heating value and specific gravity can be much more closely matched while still using a relatively high volumetric proportion of hydrogen. The Fuel 3 blend heating value is only 12% different from Fuel 1 and the specific gravity is 20% different. The resulting Wobbe number is only 0.25% different from the reference fuel, but again a 94% hydrogen fuel would almost certainly flashback (allowing the flame to propagate upstream into the burner body and damage the burner) in a wide variety of burners.
Table 1 – Comparison of Mixed Fuel Wobbe Numbers

Flame Speed Considerations
Table 2 shows flame speeds for four fuel constituents as an example[4]. The flame speed is the speed below which the flame will propagate upstream into the unburned reactants. When the speed of the fuel and oxidizer match the flame speed the flame front will remain stationary. If the speed of the reactants is higher than the flame speed, the flame will “lift-off” to a point where it can stabilize or “blow-off” and extinguish. Industrial burners typically stagnate the flow against a bluff body or another jet so that there is always a stagnation point to anchor the flame, preventing lift-off. However, for premix burners, there is usually no mechanism to prevent the flame from propagating upstream as flame arrestors typically require more airside pressure drop than is afforded to the burner in the system design.
Most hydrocarbons have a flame speed of approximately 1.5 ft/s. The flame speed of hydrogen is an order of magnitude higher. The flame speeds listed are laminar, but one can also witness the general difference in behavior in turbulent combustion flames. It is this large difference in flame speed that causes most premix burners to flashback.
Table 2 – Flame Speed for Some Fuel Constituents

It has also been this author’s experience that even nozzle mix burners may exhibit flame instability when changing to high hydrogen fuels. This is counter-intuitive because the higher flame speed and flame temperature of higher hydrogen fuel would generally cause a more robust flame closer to the burner. Most industrial burners are not strictly ‘premix’ burners where the fuel and air are mixed before the flame or ‘nozzle mix’ (also called diffusion flame) burners where the fuel and air first mix at the flame front. In most burners, choked flow nozzles mix some small portion of air or oxygen-bearing flue gas before the main flame front with fuel. Often, these mixing points occur in the annulus of a flame-holder or a flue gas recirculation port. If these locations, meant to be clear of flame, instead have flame propagate into them, the burner flame can become unstable and extinguish.
Material Considerations with Increased Hydrogen in the Fuel
Materials near the flame, either in the burner or heater, are selected according to the expected temperature and chemistry. Increasing the local temperature can rapidly destroy these materials. Table 3 shows adiabatic flame temperatures for various common refinery fuel components. One can see that if the fuel is changed and the local heat transfer away from the flame is not increased as well, the local temperature for a hydrogen flame can rise by 524°F.
For example, 304 stainless steel has a high-temperature use limit of approximately 1500°F and is often used in internal burner components[5]. If the local temperature were near to this for a burner originally designed to burn methane, the component could pass the high-temperature oxidation limit when the hydrogen content of the fuel is surpassed.
In addition to changes in temperature, one also must be aware of changes in chemistry. Burner tiles (also called ‘blocks’ or ‘quarls’) are often made of 60% alumina refractory. These refractory materials often have a substantial proportion of silica. In many burner designs, the stagnation point used to stabilize the flame is formed by impinging a fuel jet on this burner tile. From reference data, in a 2534°F hydrogen atmosphere, a brick of this material can lose 15% of its mass in only 50 hours of operation due to chemical attack [6]. Although this temperature is high compared to a refinery furnace arch temperature, the tile can become this hot locally due to the proximity of the flame. High alumina refractory reduces or eliminates this mass loss.
Table 3 – Adiabatic Flame Temperatures for Various Fuel Components

Heat Transfer Considerations with Increased Hydrogen in the Fuel
Figure 3 shows the normalized effect of changing temperature and efficiency on the peak tube metal temperature. The data used to make this graph was derived from a Lobo-Evans style calculation for a fixed radiant section and process heat transfer. When changing from low efficiency, 100% methane fired heater to a high efficiency 100% hydrogen fired heater the peak tube metal temperature changes by as much as 1.4% on an absolute basis. One should also note that changing towards 100% hydrogen fuel has a greater effect than increasing the efficiency on the peak tube metal temperature. If you are operating near the peak tube metal temperature in your fired heater this temperature increase should certainly be a consideration.
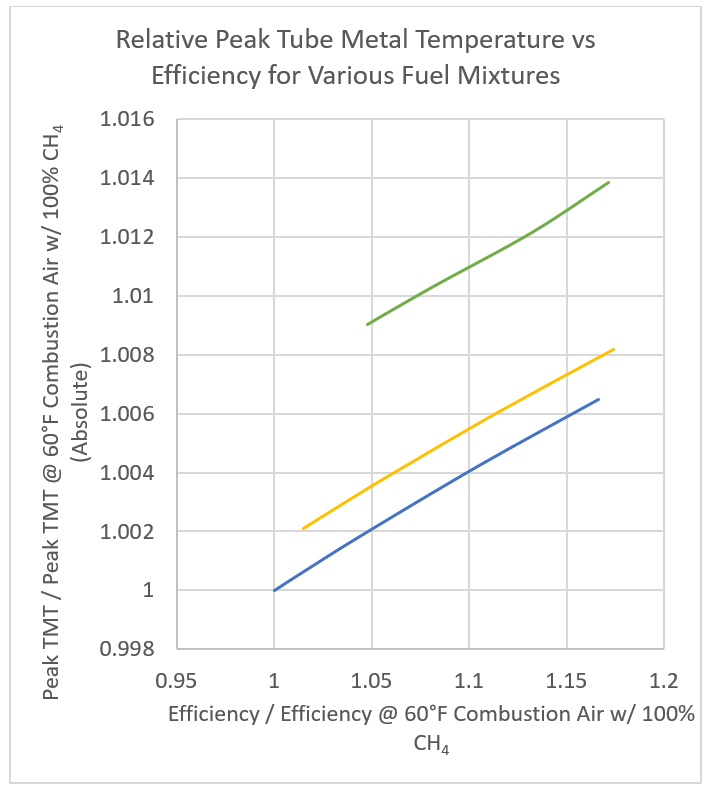
Figure 3 – Calculated peak tube metal temperature versus heater efficiency for various fuels
NOx Emissions with Increased Hydrogen in the Fuel
Adiabatic flame temperature can be used to scale most of the difference in NOx production between operating cases given a baseline NOx production from a burner. In other words, if you know the NOx production from a heater at a given adiabatic flame temperature, you can calculate the NOx produced at a new adiabatic temperature scaling from the exponential relationship between temperature and NOx. Specific burners under specific circumstances may vary but the general relationship holds.
Given this information, one can plot the change in emissions for adding hydrogen to the fuel gas. Figure 4 shows the change in NOx and CO2 emissions versus combustion air temperature for 100% CH4 combustion, a 50% CH4 / 50% H2 blend of fuel, and a 100% hydrogen fuel. The NOx for the 100% hydrogen fuel is twice that of the 100% CH4 mixture. Sufficient operating margin below the NOx permit limit or a plan to reduce NOx must be in place.
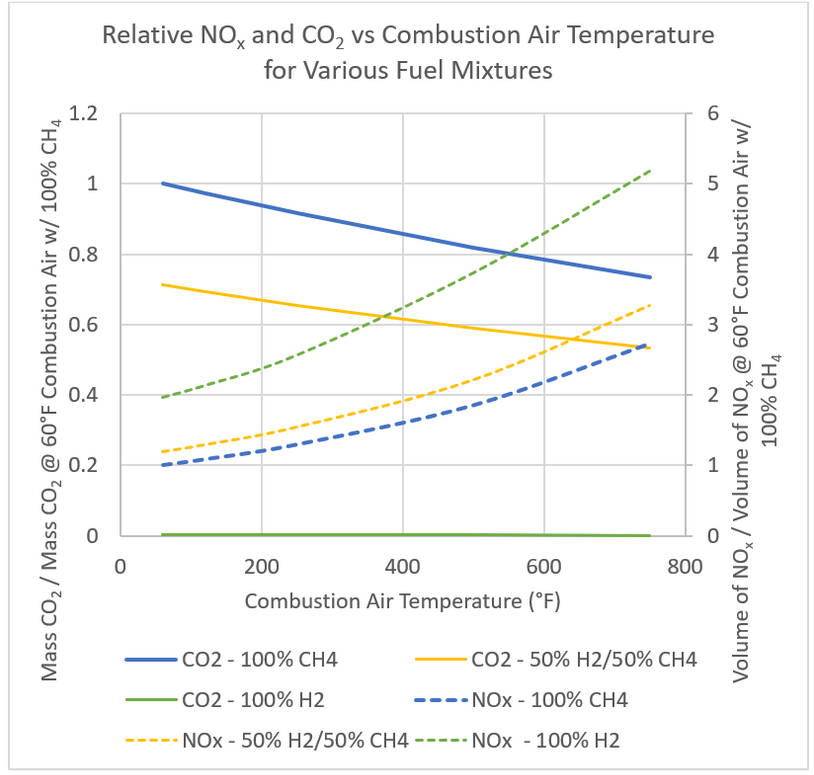
Figure 4 – Change in NOx and CO2 emissions at various combustion air temperatures for various fuel blends.
Planning Your Increase in Hydrogen Fuel Use
How does one vet the different effects when considering increasing hydrogen in a heater fuel gas system? The following list can provide a preliminary guide:
- Check burner data books and test reports from the factory acceptance testing for the valid hydrogen range.
- If you plan to operate outside the tested hydrogen range, see if the burner manufacturer has data supporting higher hydrogen use for the specific burners in your heater. Be aware that even burners with the same model number and size may have different fuel port dispositions, material of construction, and flame holder designs.
- Consider replacing low alumina burner tiles with high alumina (85% or greater).
- If the data or a reference installation that the manufacturer warrants to be identical is not available, you will have to test the burners.
- If you are supplied with new fuel nozzles for high hydrogen operation, be aware the flame quality will likely suffer for low hydrogen fuels.
- You may need to reset the low- and high-pressure fuel trips on the heater.
- The airflow requirement is much lower for high hydrogen fuels than high carbon fuels. It may be difficult to size the burner for both. The reduced flue gas flow will also reduce the velocity and heat transfer across the convection section.
- You may need new pressure sensors to cover the entire fuel pressure range.
- Compare the measured tube metal temperature versus the new potentially increased tube metal temperature.
- Ensure that you will not exceed NOx limits when increasing the hydrogen content in the fuel.
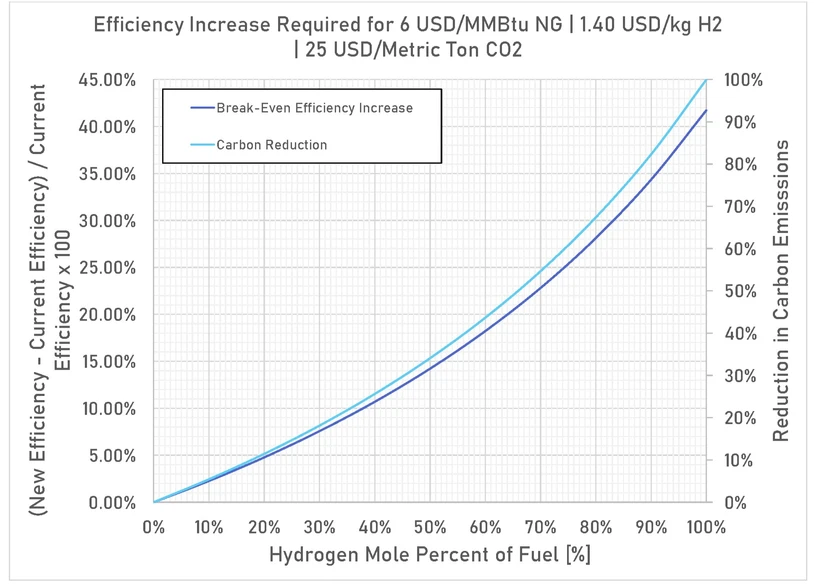
Figure 5 – Efficiency improvement required for no operating cost increase over current costs.
Optimizing Hydrogen Usage
Returning to the economic calculations in the first section of this paper, one can see that increasing heater efficiency reduces operating costs and increasing the amount of hydrogen increases operating costs. Both steps reduce carbon dioxide emissions. Increasing efficiency also reduces hydrogen consumption when hydrogen is added to the fuel gas system. Using this observation, one can calculate the efficiency required to make operation with added hydrogen completely offset the added cost.
Figure 5 shows the efficiency increase required to completely offset the cost of hydrogen using fuel, blue hydrogen (hydrogen where the CO2 from production has been sequestered), and emissions credit prices like in the EU. This provides a guide to which heaters are good candidates for efficiency projects to reduce hydrogen. For example, a project that increases efficiency by 15% and adds 50% hydrogen to the fuel will completely offset any additional cost of operating with hydrogen and reduce CO2 emissions by 34%. The post-improvement project hydrocarbon fuel cost, hydrogen fuel cost, and carbon dioxide cost are set to be equivalent to the pre-project hydrocarbon fuel cost and carbon dioxide cost so there is no pay-back for the curves shown. To achieve a payback, the hydrogen costs would have to be lower or the carbon dioxide prices higher given the same efficiency increase. Projects such as these are particularly attractive because they do not change the current profitability of the refinery but result in sizeable carbon dioxide reductions.
Conclusions
Reduced fuel costs from efficiency improvements can pay for the project within an industry-accepted timeframe. Higher fuel and carbon costs make these projects more attractive for a wider range of heaters. Adding hydrogen to the fuel gas system also reduces the carbon emissions from fired heaters but can greatly increase operating costs. Lower hydrogen costs and higher carbon costs make the addition of hydrogen more attractive.
Numerous technical details must be considered when increasing hydrogen use. These include the flame speed, materials of construction, heat transfer, and NOx. Other items must be considered such as whether the current burners can operate with increased hydrogen and the low- and high-pressure trips on the heater.
As hydrogen costs come down and carbon dioxide prices rise, adding hydrogen to the fuel gas system of a fired heater will become more attractive. For refineries that are fuel-long it is difficult to justify the replacement of fuel gas with hydrogen on an economic basis but for carbon credit prices. For other refineries, when coupled with an efficiency improvement project, the operating cost of the heater can remain the same while at the same time achieving sizeable carbon dioxide emissions reductions.
About the Author
Matthew Martin, Chief Research Scientist at XRG, has over 27 years of experience in combustion with 17 years of experience in the computational fluid dynamic simulation of fired equipment. Matt received a Bachelor of Science in Computer Science from the University of Tulsa. In addition to his technical role in leading R&D projects, he as worked as an Engineering Manager and a Product Line Manager leading from market validation through commercialization for petrochemical and refinery products. He has written for numerous publications and is listed as an inventor or co-inventor on 28 patents for combustion equipment, flame visualization, and computational techniques.
References
| [1] | “Greenhouse Gas Reporting Program Industrial Profile: Petroleum Refineries Sector,” USA EPA, 2017. |
| [2] | “A wake-up call on green hydrogen: the amount of wind and solar needed is immense,” [Online]. Available: https://www.rechargenews.com/transition/a-wake-up-call-on-green-hydrogen-the-amount-of-wind-and-solar-needed-is-immense/2-1-776481. [Accessed 6 May 2021]. |
| [3] | T. A. Williams, “Technical Background and Issues of Gas Interchangeability,” American Gas Asssociation, 2006. |
| [4] | R. J. Reed, North American Combustion Handbookx, North American Manufacturing Company, 1978. |
| [5] | “High Temperature Characteristics of Stainless Steels,” American Iron and Steel Institude, 2011. |
| [6] | M. Crowley, “New Data on Hydrogen-Silica Refractories,” American Oil Company, Whiting, Indiana, 1967. |